Investing in Solar Panels: Costs and Savings
Investing in Solar Panels: Costs and Savings
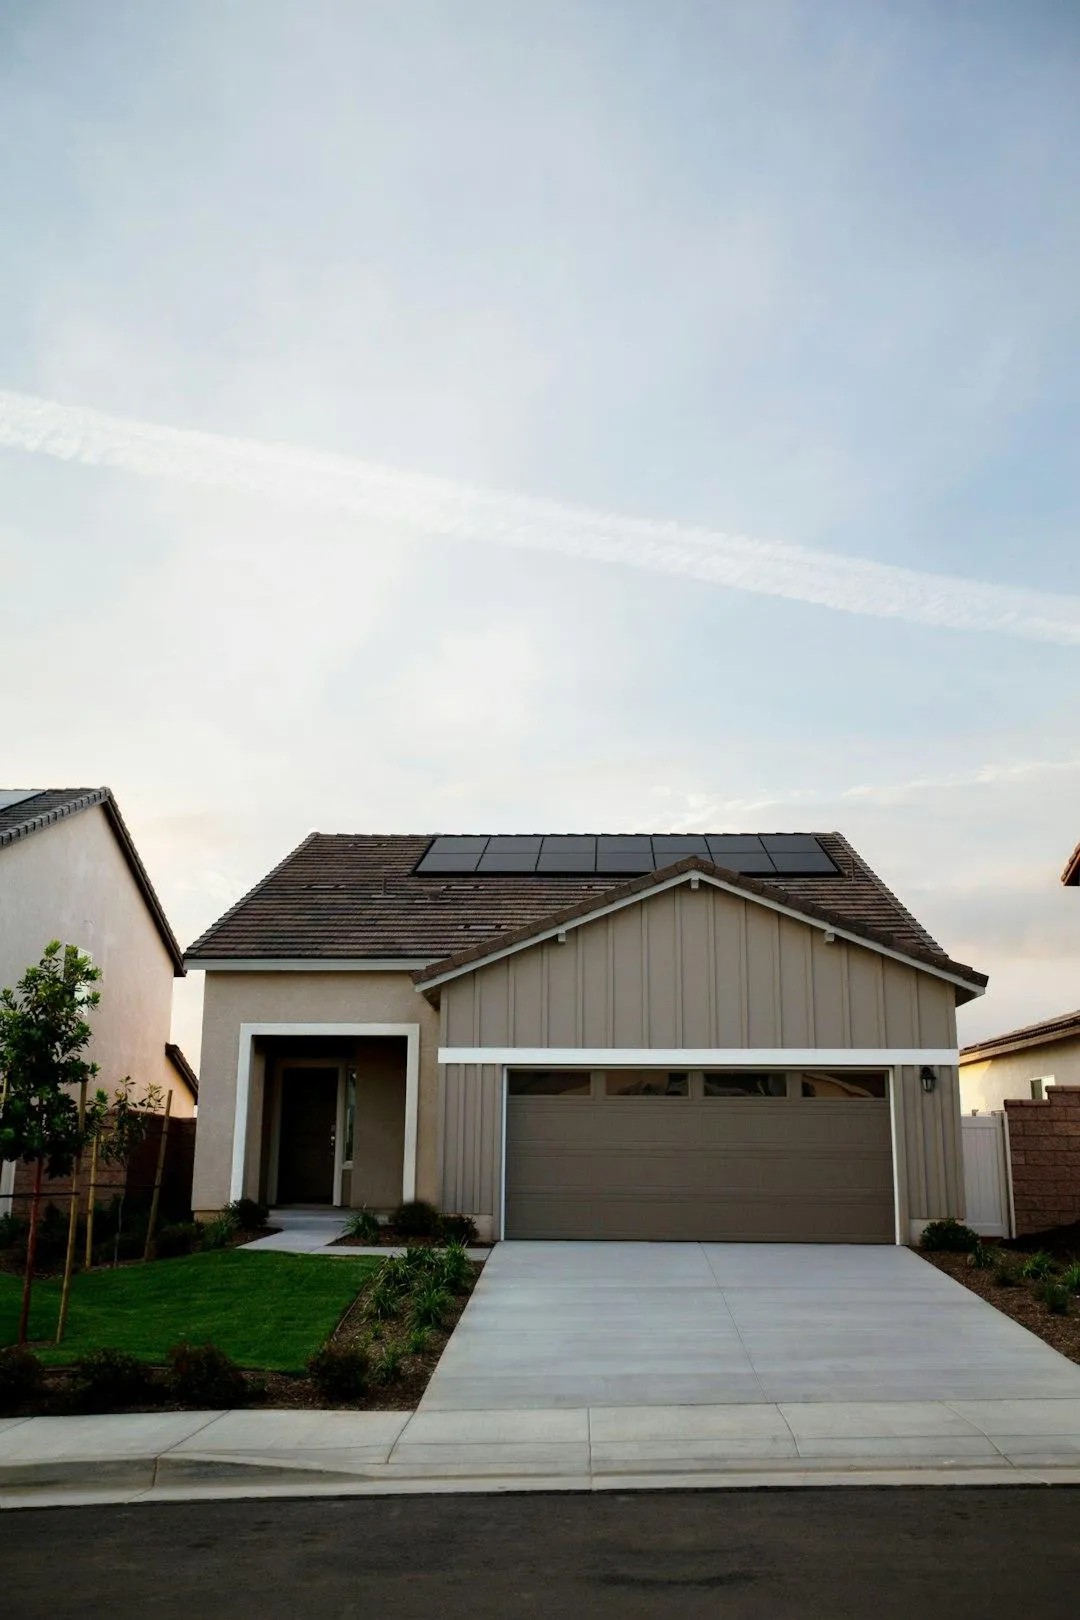
Did you know homeowners could save up to $100,000 over three decades by switching to renewable energy systems? While the initial investment might seem steep—like the $20,552 price tag for an 11 kW setup after incentives—the long-term payoff often outweighs upfront expenses. Federal programs, including a 30% tax deduction, slash net prices while boosting returns.

Data from EnergySage reveals that electricity rate fluctuations heavily influence savings. For example, households in high-cost regions might pocket over $82,000 in 30 years. Local rebates and performance-based incentives further trim expenses, making photovoltaic installations more accessible than ever.
Beyond finances, these systems reduce carbon footprints by an average of 3-4 tons annually. This guide breaks down installation fees, incentive structures, and realistic timelines for breaking even. Let’s explore how sunlight can power both your home and wallet.
Key Takeaways
Long-term savings often exceed $30,000, with some systems generating six-figure returns.
Federal tax credits cover 30% of installation fees, drastically lowering net costs.
Electricity rates and regional incentives significantly impact overall financial benefits.
Photovoltaic setups reduce greenhouse gas emissions while cutting utility bills.
Third-party data from EnergySage and the U.S. Energy Information Administration validate projections.
Upfront investments are offset by decades of reduced energy expenses.
Overview of Solar Panel Investment
Switching to renewable energy transforms monthly budgets while protecting ecosystems. Homes using photovoltaic systems typically see electric bills drop by 60-100%, with net metering programs amplifying these savings. For instance, California households earn credits worth $0.20-$0.30 per kilowatt-hour for excess energy fed back to the grid.
Why Solar is a Smart Investment
Net metering turns rooftops into revenue streams. Utilities compensate homeowners for surplus power, slashing annual energy expenses. A 2023 study found U.S. families save $1,500 yearly through these programs. Combined with federal solar tax deductions covering 30% of setup fees, upfront investments shrink dramatically.
"Renewable incentives make clean energy accessible while stabilizing long-term household budgets," notes the National Renewable Energy Laboratory.
Environmental and Financial Benefits
Beyond lowering electric bills, each residential installation prevents 8,000 pounds of annual carbon emissions—equivalent to planting 130 trees. Financially, regions with high utility rates like Hawaii and Massachusetts achieve payback periods under 7 years. Rising electricity costs—up 4.3% nationally in 2024—make locked-in renewable rates a shield against inflation.
Local solar tax exemptions further boost returns. Arizona residents, for example, eliminate property tax hikes from system upgrades. This dual advantage—economic resilience and ecological stewardship—positions photovoltaic technology as a cornerstone of modern home planning.
Breakdown of Solar Panel Costs
Understanding where your money goes helps make informed decisions. A typical setup includes three core elements: photovoltaic modules, inverters, and mounting structures. Modules capture sunlight, while inverters convert it into usable electricity. Mounting hardware secures everything in place.

Equipment vs. Labor Fees
Installation charges account for 10-25% of total expenses. For a 10 kW array, equipment might cost $18,000 before discounts. Professional labor adds $2,000-$4,500 depending on roof complexity. The national average sits at $2.56 per watt—meaning a 7 kW unit runs $17,920 pre-incentives.
Financial Perks That Lower Bills
Federal programs slash nearly a third off initial outlays. Combine this with state rebates, and an $27,000 11-kW project drops to $20,552. States like New York offer extra perks—some cover 25% of remaining fees after federal deductions.
Inverters last 10-15 years vs. 25+ years for modules
Ground mounts cost 15% more than rooftop setups
High-efficiency units generate 20% more power in limited spaces
Energy output estimates determine system sizing. A Phoenix home needing 12,000 kWh yearly might require 18 modules, while a Seattle residence could need 22. Proper sizing by certified technicians ensures maximum returns.
Solar Panel Costs and Savings
Where you live dramatically impacts both upfront fees and long-term returns. EnergySage reports a $9,000 difference in average installation expenses between states—$14,500 in Arizona versus $23,600 in New York. These variations stem from labor rates, permitting rules, and equipment preferences.
Federal Solar Tax Credit and Local Incentives
The 30% federal tax deduction remains available through 2035, directly reducing income taxes owed. This solar tax credit can make a big difference when deciding whether or not to invest in solar. Combine this with state-specific perks like Massachusetts' $1,000 rebate or Illinois' 15% property tax exemption. "Stacking incentives cuts payback periods by 40% in high-rate regions," explains Energy Sage's 2024 market report.
Cost Comparisons by State
Hawaii residents see 6-year paybacks due to $0.41/kWh electricity rates—triple the national average. Contrast this with Louisiana's $0.09/kWh rates, where systems take 12 years to break even. Key factors influencing returns:
California offers $3/Watt rebates for low-income households
Texas waives sales taxes on renewable equipment
Colorado grants 20% state tax credits
Areas with tiered utility pricing, like Connecticut, amplify monthly bill reductions. Households exceeding baseline usage save 30% more annually through peak shaving. Regional policies transform identical systems into vastly different financial assets.
Factors Affecting Solar Costs
Technological advancements and regional policies create a complex pricing landscape for renewable energy setups. Equipment choices, local regulations, and financing methods all shape initial investments and long-term value.

Equipment Performance and Brand Variations
High-efficiency modules convert 22-23% of sunlight into power versus 15-17% for standard models. Premium brands like SunPower charge 20% more upfront but generate 30% extra output over two decades. Tesla's Powerwall batteries add $11,500-$15,000 to projects but provide backup during outages.
Scale and Supplementary Components
Larger systems require more robust mounting structures and upgraded electrical panels. A 12 kW array might need $2,500 in additional hardware compared to a 6 kW setup. However, expanded capacity reduces reliance on grid power by 65-90% in sun-rich states like Nevada.
Regional Pricing and Payment Strategies
Installation quotes vary by $4,000-$8,000 between providers in the same zip code. A 2024 EnergySage report found cash purchases lower lifetime expenses by 12% versus loans. States like New Jersey offer 10-year property tax exemptions, while Florida provides sales tax waivers on equipment.
"Comparing three quotes minimum helps homeowners save $3,000 on average while identifying quality installers," states a DOE-funded residential energy study.
Key considerations for maximizing value:
Warranty lengths differ (10-25 years across manufacturers)
Microinverters boost efficiency in shaded areas
Lease agreements lock in rates but limit incentive claims
Calculating Your Solar Energy Savings
Crunching the numbers reveals how renewable setups reshape household budgets. The U.S. Energy Information Administration reports average monthly electric bills dropped 62% for homes with these systems, translating to $100-$150 in savings. Providers offer online calculators that factor in local sunlight hours and utility rates to estimate annual reductions.
Estimating Reduced Electric Bills
Start by reviewing 12 months of utility statements to determine your kWh usage. Multiply this figure by your current electricity rate—state averages range from $0.09 (Louisiana) to $0.41 (Hawaii) per kWh. A 10 kW system generating 12,000 kWh annually slashes bills by 75% in areas with $0.20 rates.
Many companies provide monitoring tools tracking real-time production. These dashboards compare your system’s output to grid consumption, showing exact dollar amounts saved daily. Net metering credits appear as negative balances on statements, further lowering costs.
Long-Term Return on Investment
Payback periods vary from 3.7 years in high-rate states to 19.1 years where electricity remains cheap. Consider this formula:
Total system cost ÷ Annual savings = Break-even timeline
$20,000 installation ÷ $1,800 yearly savings = 11.1 years
"Properly sized systems deliver 20-30 years of bill reductions, often outperforming traditional investments," states a 2024 renewable energy market analysis.
Fixed electricity rates protect against price hikes, while performance warranties ensure consistent output. Over three decades, households in Connecticut save $82,000 versus $28,000 in Texas—proof that location dictates financial outcomes.
Conclusion
Investing in clean energy solutions balances upfront expenses with future gains. Federal tax credits covering 30% of installation fees, paired with state rebates, slash net prices significantly. Real-world examples show households in high-rate states like Hawaii achieve payback in 6 years versus 12 years in low-cost regions.
System size and local energy consumption patterns directly impact returns. Quality installations in sun-rich areas often offset 90% of grid reliance, while precise sizing ensures optimal performance. Regional variations matter—Massachusetts offers $1,000 rebates, while Texas eliminates sales taxes on equipment.
Review your electric bills and area-specific data to gauge potential benefits. Though initial investments range from $14,500 to $23,600 across states, decades of reduced bills and tax exemptions create lasting value. Environmental gains—equivalent to planting 130 trees annually—add to the appeal.
Explore local incentive programs and consult multiple installers to maximize savings. With smart planning, renewable systems transform rooftops into long-term financial and ecological assets.
FAQ
How do tax credits lower installation expenses?
The federal Investment Tax Credit (ITC) allows homeowners to deduct 30% of their renewable energy system costs from federal taxes. Many states and utilities offer additional rebates or performance-based incentives, further reducing upfront charges.
What factors influence pricing differences across regions?
Local labor rates, permitting fees, and sunlight availability impact total expenses. States like California and Massachusetts often have higher equipment demand but also provide stronger incentive programs, balancing overall affordability.
How long does it take to recoup initial investments?
Payback periods typically range between 6-12 years, depending on utility rates, energy consumption, and system performance. Areas with high electricity prices or net metering policies often see faster returns.
Can efficient models save money despite higher upfront costs?
Premium-tier modules with 22%+ efficiency generate more kilowatt-hours per square foot, requiring fewer units. This offsets initial price differences over time, especially in limited roof spaces.
Does weather affect production estimates?
Yes. Systems in cloudy climates may produce 10-25% less annually than sun-rich regions. Installers use historical irradiance data and shading analysis to create location-specific generation forecasts.
Are battery backups worth the added expense?
Storage units like Tesla Powerwall add $10,000+ but provide energy resilience during outages. They’re cost-effective in areas with frequent blackouts or time-of-use rate structures that penalize peak-hour usage.
How do financing options compare?
Cash purchases yield maximum savings over 25+ years. Loans and leases (PPAs) have $0-down options but include interest fees or escalator clauses that reduce long-term benefits compared to outright ownership.
